Harmonic Patterns

Trading chart patterns are the foundation of technical analysis. There are numerous types of patterns, and it is not really necessary for technical analysts to master them all. Rather, it is important to understand how they form and what message they convey. Price patterns illustrate how an asset’s price reacts to support and resistance lines or areas in the market, including trendlines. Trading patterns can signal transitions between different market conditions, such as uptrends and downtrends, or a continuation of prevailing conditions. When understood, traders are able to use trade patterns to anticipate future price behaviour and to take advantage of lucrative trade opportunities in the market.
Harmonic patterns are some of the most efficient and effective trading patterns in technical analysis. Compared to other patterns, they are more advanced and can help technical analysts decipher even more price action information in the markets. They combine raw price action analysis with the mathematical tool, Fibonacci, to create geometrical structures that provide more qualified trading opportunities in the markets. Harmonic patterns essentially allow traders to view order in chaotic price action and to appreciate how price swings and retracements correlate with Fibonacci sequences. Harmonic patterns generate powerful, high probability trading signals with clear entries, stops, and targets that are likely to offer attractive risk/reward ratios.
Mechanics of Harmonic Patterns
Harmonic patterns are designed to identify quality turning points in the market. To be considered valid and tradable, harmonic patterns must meet defined movement conditions based on Fibonacci retracements and extension levels. Fibonacci retracements are used to determine levels where the price is likely to resume the direction of the dominant trend, whereas Fibonacci extensions are used to determine high probability price targets in a trending market.
ABCD Pattern
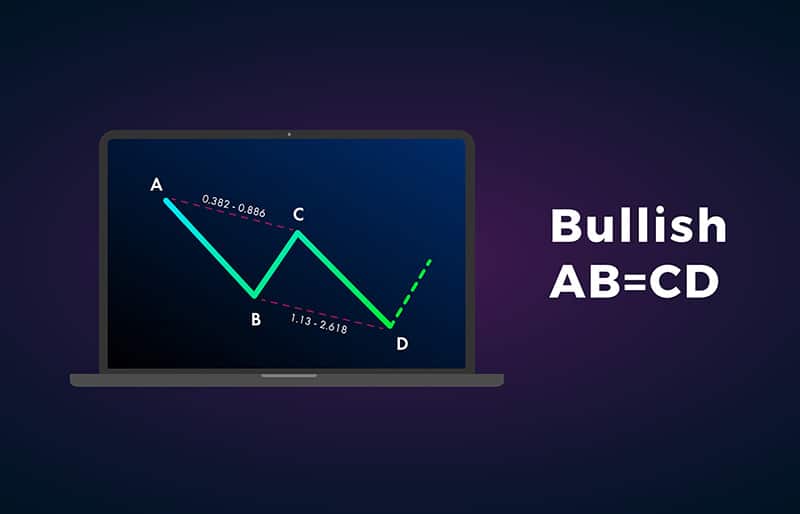
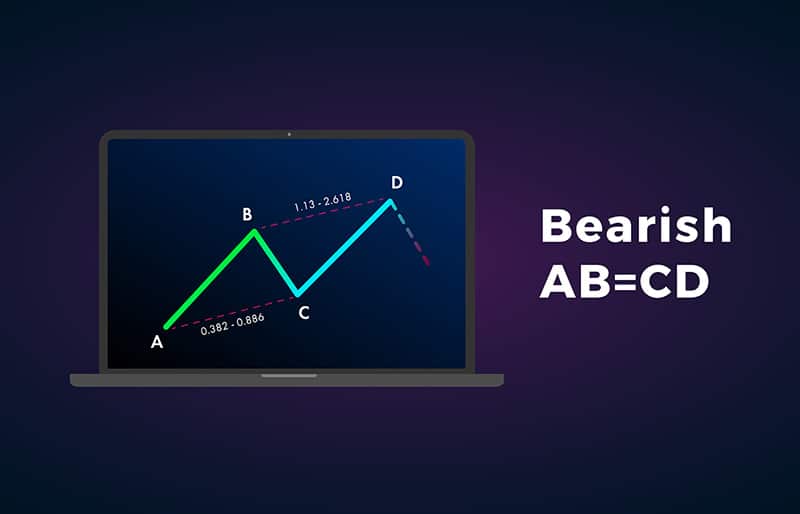
The classic ABCD pattern forms the basis of all harmonic patterns. This pattern consists of the impulsive AB movement, which is followed by the retracement move BC, and finally another impulsive movement CD.
When using the Fibonacci retracement tool, the BC leg should ideally be a 0.618 (or lower) retracement of the impulsive AB leg. The final CD movement will then be roughly the same size as the first impulsive AB movement.
To trade the ABCD pattern, traders can enter trades after the BC corrective phase so as to ride the CD impulsive phase. Alternatively, they can wait for the whole pattern to be completed so as to trade the expected reversal at point D.
Types of Harmonic Patterns
BAT Pattern
The BAT pattern contains the ABCD pattern, in addition to an extra price point labelled X, which precedes the ABCD movement. The entire pattern resembles a ‘bat’, and it can either be bullish or bearish.
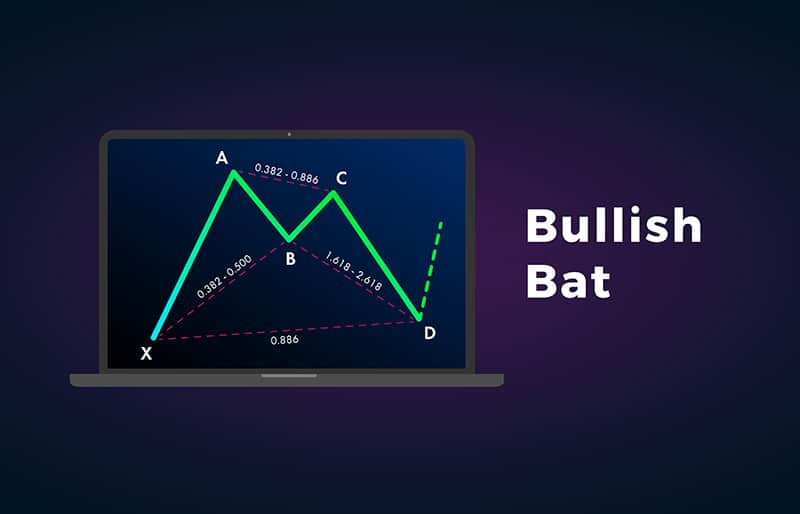
A bullish BAT pattern will resemble an ‘M’. It forms as follows:
- A price moves sharply higher from point X to A. XA is the longest leg of the pattern.
- AB will then retrace less than 0.618 of XA. The ideal retracement levels will be between 0.382 and 0.50.
- BC will then retrace between 0.382 and 0.886 of AB.
- CD will finally be an extension between 1.618 and 2.618 BC. Point D should be about a 0.886 retracement of point X.
An asset’s price is expected to reverse at D. A buy order will be placed there with a stop below X. Profit targets will be Fibonacci levels between A and D.
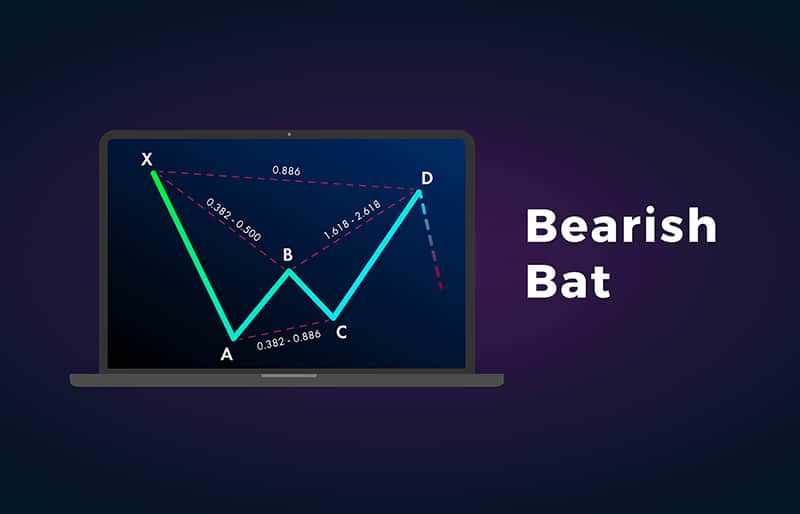
A bearish BAT pattern will be the reverse of the bullish pattern and will resemble the letter ‘W’, with the initial leg being a sharp decline from X to A. At point D, a sell order will be placed with a stop above X and profit targets being Fibonacci levels between A and D.
Gartley Pattern
The Gartley pattern resembles the BAT pattern, but it demands slightly different conditions for the movements. The two conditions that must be met are:
- Point B must be precisely around 0.618 of XA
- Point D must be precisely around 0.786 of XA
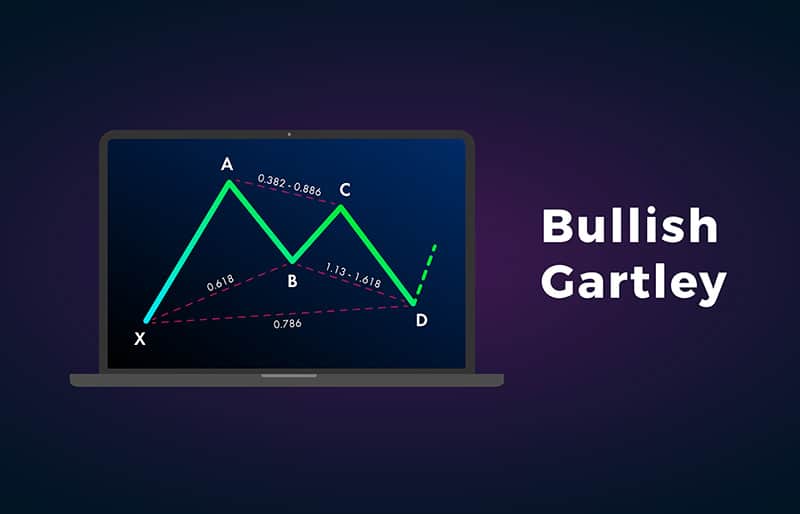
A bullish Gartley pattern will also resemble an ‘M’ and buy orders will be placed at D and stops at or below X, with the profit target at C.
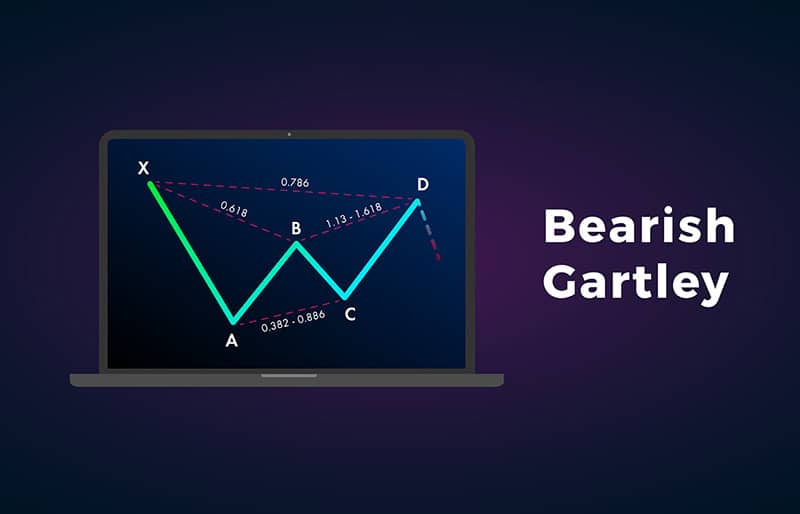
Similarly, a bearish Gartley pattern will resemble a ‘W’, and sell orders will be placed at D and stops at or above X with the profit target at C. Additional profit targets will be Fibonacci retracement and extension levels of AD.
Butterfly Pattern
The butterfly harmonic pattern also features the XABCD price movement legs, but with some key characteristics that distinguish it from the above two patterns. They include:
- AB retraces about 0.786 of XA
- CD is an extension of between 1.618 and 2.24 of AB
- In a bullish pattern, point D is lower than point X; and in a bearish pattern, point D is higher than point X.
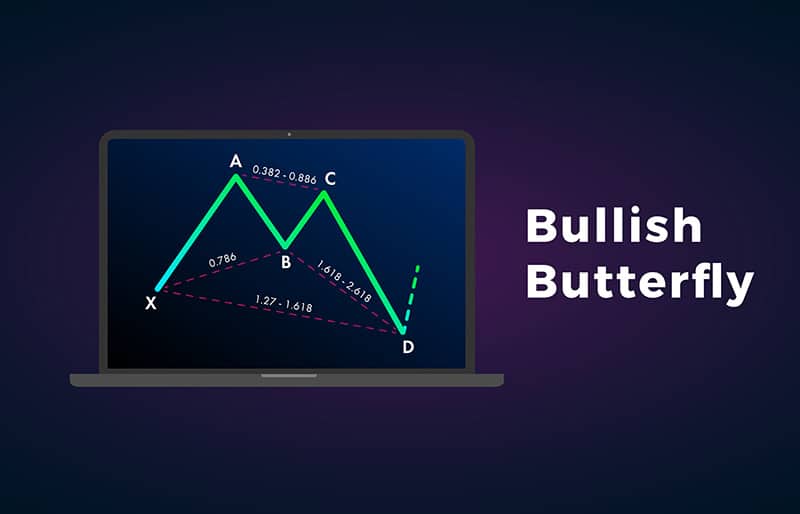
When a bullish butterfly pattern forms, traders will place buy orders when the price appreciates off point D. Stops will then be placed below the swing point D, with profit targets based on Fibonacci levels derived from AD.
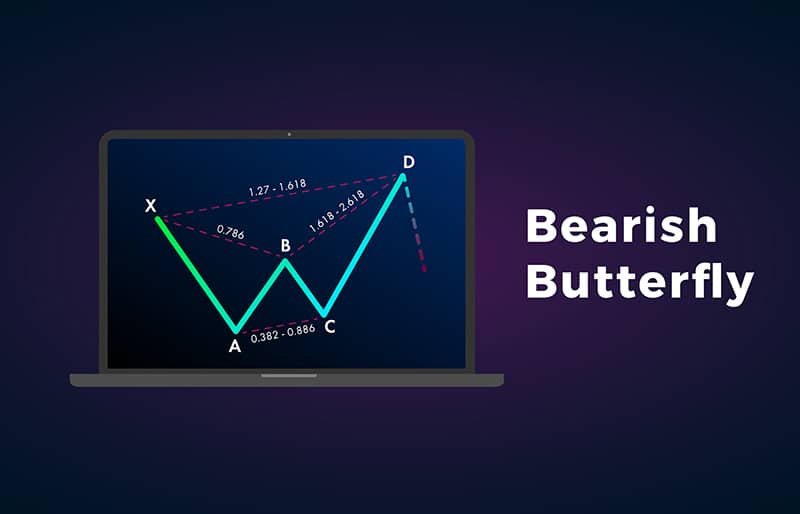
Similarly, when a bearish butterfly pattern forms, sell orders will be placed when the price moves lower off point D. Stops will be placed above swing point D, with profit targets placed on Fibonacci levels projected from AD.
Crab Pattern
The Crab pattern is similar in structure to the butterfly pattern. Its distinguishing features are:
- CD is an extension of between 2.618 and 3.618 of BC
- Point D is an extension of about 1.618 beyond XA
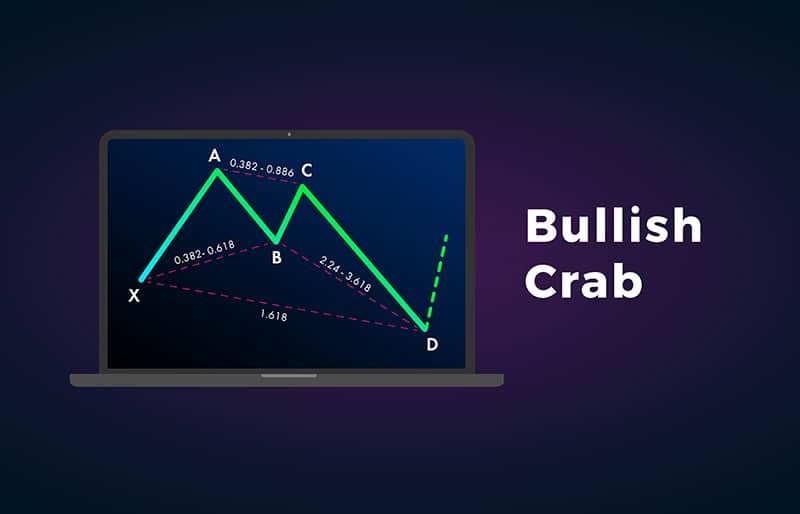
When a bullish crab pattern forms, traders will look to place buy orders when the price starts to rise off point D. Stops will be placed below swing point D, with profit targets being Fibonacci levels of AD.
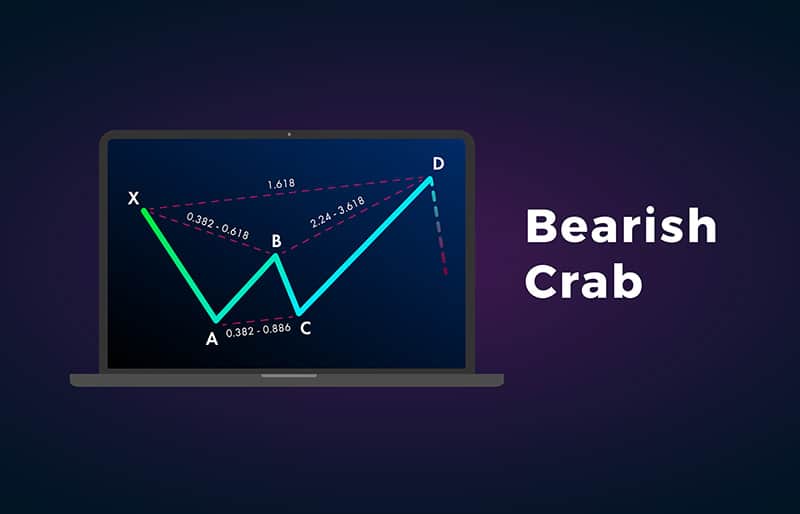
In the same manner, when a bearish crab pattern forms, traders will look to place sell orders when the price starts to fall off point D. Stops will be placed above swing point D, with profit targets being Fibonacci levels of AD.
Cypher Pattern
The distinguishing features of the cypher harmonic pattern include:
- AB retraces between 0.382 and 0.618 of XA
- Point C extends beyond point A by at least 1.272, but not more than 1.414
- Point D does not extend beyond 0.786 of point X
In a bullish cypher pattern, X is the pattern low, while C is the pattern high. Buy trades are entered at point D, with the stop at or below X, and profit targets at A and Fibonacci retracements of CD.
In a bearish cypher pattern, X is the pattern high, while C is the pattern low. Sell trades are entered at point D, with the stop at or above X, and profit targets at A and Fibonacci retracements of CD.
Limitations of Harmonic Patterns
Like every other strategy, harmonic patterns are no holy grail; they have their limitations. Some of the disadvantages of harmonic patterns include:
- They Are Subjective
The success of harmonic patterns largely depends on the proper identification of the initial XA impulsive move. This is the foundation of all harmonic patterns, and it is the most subjective decision of all. At any given time, there are many impulsive moves on a chart, and plotting the correct one is not an easy task. Additionally, it is easy for traders to try to ‘force’ the market to conform to their pattern. - Easy To Miss Big Trends
It takes patience for traders to see out the formation of any harmonic pattern on a chart. In some of the patterns, some legs constitute massive price movements, and traders can miss out on such big trends as they wait for the formation of a complete pattern. - Can Be Ineffective in Ranging Markets
Due to the nature of their formation, harmonic patterns can easily occur in ranging markets. But their success rate is so low in such markets, and their formation can lead to the generation of low quality, low probability trading signals. - Stop Hunts
Harmonic patterns have defined areas for stop placement. But the stops are really tight and can easily be triggered in volatile markets.
Using Harmonic Patterns in Trading
Despite their limitations, harmonic patterns are very effective in forecasting price direction in practically any timeframe. To further improve their accuracy, it is important to read the chart correctly while taking into account the prevailing price, trend, volatility, and even market sentiment. The efficiency of the patterns can also be improved by also incorporating other technical analysis tools. In particular, Oscillators, such as RSI as well as support and resistance lines, can help to qualify the buy/sell signals generated by harmonic patterns. In the end, it is important to continuously practise reading and identifying the patterns correctly so as to reap maximum profitability out of harmonic trading.
Do you want to try harmonic trading?
Sign up for a demo account at AvaTrade now and practice drawing and trading harmonic patterns risk-free. Develop, tweak and trade as many harmonic strategies as you wish without putting any money on the line!
Experience the power of harmonic trading with AvaTrade. Sign Up Now.


