Ichimoku Cloud Indicator and Strategies
- Ichimoku Cloud Explained
- Reading and Trading the Ichimoku Cloud Indicator
- Best Ichimoku Strategies
- Trading with the Ichimoku Cloud Indicator at AvaTrade
- FAQ
The Ichimoku Cloud indicator was developed in the 1930s by the Japanese journalist, Goichi Hosoda. The inspiration behind this development was that the Ichimoku Cloud would be a technical analysis tool that can combine multiple strategies but be plotted as one indicator on a chart.
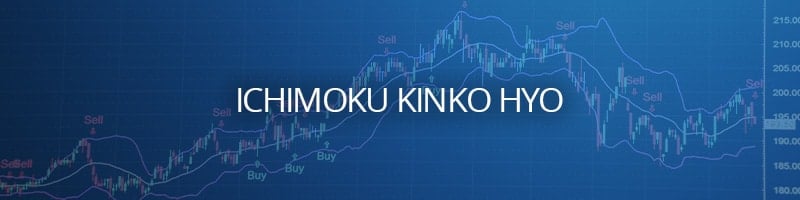
Also known as Ichimoku Kinko Hyo (which translates as ‘a one-look equilibrium chart’), the indicator helps traders to pick out high-quality trading opportunities in trending markets, to establish price momentum, as well as to plot definitive support and resistance price zones.
Goichi released the indicator to the mainstream public in the 1960s after almost three decades of perfecting it, and Ichimoku has since been one of the most popular indicators for investors of all types.
Although a versatile and comprehensive indicator, the Ichimoku Cloud remains largely a momentum-based trend-following technical analysis tool, similar to indicators, such as the Parabolic SAR, Bollinger Bands and Moving Averages.
Ichimoku Cloud Explained
The Ichimoku Cloud indicator is composed of 5 lines that are computed as follows:
- Tenkan Sen
Tenkan Sen = (9-period high + 9-period low)/2
Also known as the conversion line, Tenkan Sen is usually red in colour and is plotted as a moving average of the midpoints of the past 9 periods. - Kijun Sen
Kijun Sen = (26-period high + 26-period low)/2
Also known as the baseline, Kijun Sen is usually white in colour and is plotted as a moving average of the midpoints of the past 26 time periods. - Senkou Span A
Senkou Span A = (Tenkan Sen + Kijun Sen)/2
Usually yellow in colour, Senkou Span A is plotted as the midpoint of Tenkan Sen and Kijun Sen, with the line projected 26 time periods into the future. - Senkou Span B
Senkou Span B = (52-period high + 52-period low)/2
Usually blue in colour, Senkou Span B is plotted as a moving average of the midpoints of the past 52 periods, with the line projected 26 time periods into the future. - Chikou Span
Usually green in colour, Chikou Span is the current closing price, plotted 26 time periods back.
It is the Senkou Span lines that form the borders of the ‘cloud’. When Senkou Span A is above Senkou Span B, the shade of the cloud is usually green; and when Senkou Span B is above Senkou Span A, the shade of the cloud is usually red.
Reading and Trading the Ichimoku Cloud Indicator
When observing the ‘weather’ of the markets using the Ichimoku Cloud indicator, it is important to start with the ‘cloud’. A green cloud indicates a bullish trend, whereas a red cloud indicates a bearish trend. There is also bullish sentiment when prices are above the cloud and bearish sentiment when prices are below the cloud; prices within the cloud indicate a neutral market stance.
The size of the cloud also matters; a narrow cloud implies a weak trend, while a wider cloud implies a strong underlying trend. As stated above, cloud borders are computed as moving averages. It is, therefore, important to watch for crossovers of the Senkou Span lines (or simply changes in the colour of the cloud), which indicate trend reversals. Because Senkou Span lines are projected into the future, they also act as potential dynamic support and resistance lines depending on where the price lies.
For faster and more frequent trading signals, traders observe the Kijun Sen and Tenkan Sen lines in relation to the price. As the baseline, Kijun Sen is an indicator for future price action and literally acts as a price magnet.
Generally, prices above Kijun Sen mean that the market may keep rising, while prices below Kijun Sen mean that the market may continue lower. A strong bullish signal occurs when the price is above a Kijun Sen line that is also above the cloud; whereas a strong bearish signal occurs when the price is below a Kijun Sen line, that is also below the cloud.
The Tenkan Sen line is a shorter period moving average that reacts to trend changes faster and it also takes into account recent price extremes. Its slope shows the market trend, and when it moves sideways, it signals a ranging market.
Tenkan Sen is essentially a signal line; a buy signal is produced when the Tenkan Sen crosses above the Kijun Sen, while a sell signal is generated when the Tenkan Sen crosses below the Kijun Sen.
The Chikou Span is also an interesting line, mainly because the current closing price is extended backwards. But this is very important in putting the current price action into context.
Chikou Span can confirm support and resistance levels, but it is the crosses with the asset price that deliver tradable signals. A buy signal is generated when the Chikou Span crosses the price from below, while a sell signal is produced when the Chikou Span crosses the price from above. Chikou Span crosses with Kijun Sen and Tenkan Sen can also provide confirmation signals for buy and sell orders.
Best Ichimoku Strategies
The Ichimoku Cloud is a comprehensive indicator that can be used as a completely standalone indicator. Still, it can be complemented with other tools to deliver low risk, high probability trading signals.
In trending markets, it is well complemented by the Fibonacci retracement tool. For instance, when prices are above the cloud, traders can watch out for bullish Kijun Sen and Tenkan Sen crosses at important Fibonacci levels, such as 38.2% and 61.8%.
Ichimoku consists of multiple lines that can act as support and resistance, but it remains a relatively weak indicator in ranging markets. Ichimoku can tell when a market is ranging, and by combining it with oscillators, such as the RSI (relative strength index) and Stochastics, that signal overbought and oversold conditions, traders can pick out optimal entry and exit points in ranging markets.
Trading with the Ichimoku Cloud Indicator at AvaTrade
Here are some of the reasons why you should trade with the versatile Ichimoku Cloud indicator with AvaTrade, an award-winning and regulated broker:
- Multiple Timeframes. Ichimoku trading signals are effective on any chart timeframe. Trade with the indicator on up to 21 timeframe charts available at AvaTrade.
- Education. Take advantage of the comprehensive and relevant educational resources available at AvaTrade to fully understand the simplicity and effectiveness of the Ichimoku Cloud, an indicator widely considered as complex.
- Multiple Assets. Apply the Ichimoku indicator on over 1,000 financial assets available at AvaTrade that include Currency Pairs, Stocks trading, Commodities and Indices.
- Demo Account. Learn, test and tweak different Ichimoku trading strategies on a demo account without putting any money at risk.
Main Ichimoku Cloud Indicator FAQ
- What is Ichimoku cloud strategy?
Released to the public in the 1960s by Japanese journalist Ichimoku Sanjin, it is a type of technical analysis method that is based on Japanese candlestick charts and is used to predict the future price movement of assets. The idea behind the strategy is to use a moving-average based trend method that indicates the future direction price will take. In addition to using price, the Ichimoku cloud strategy also uses time as one of its components. This use of multiple data points is considered to make the strategy more accurate than simply charting price as Japanese candlesticks do.
- How do I trade with Ichimoku cloud?
There are several strategies that have developed that have been found to be successful when trading based on the Ichimoku cloud indicator. The most basic is the pure cloud trading strategy, which is a breakout strategy that enters a trade when price breaks out from the Ichimoku cloud. The trade remains in place until price re-enters the cloud at which point the trade is closed and another breakout is awaited. There are additional components that can be added for much advanced trading set-ups, such as the Kijun Sen, the Tenkan Sen, and the Chinoku Span.
- What is the best indicator to use with Ichimoku?
The Ichimoku can be used all by itself as an indicator, but when combined with other indicators it is possible to find confluence that increase the robustness and success of the strategy. The Relative Strength Index seems to be one of the best to combine with the Ichimoku Cloud. Using the RSI can help identify divergences and high probability reversal setups. Not only can the RSI help locate reversals, it can even find long term trend reversals with excellent profit potential.
** Disclaimer – While due research has been undertaken to compile the above content, it remains an informational and educational piece only. None of the content provided constitutes any form of investment advice.


