RSI Trading Strategies

Table of content
- What is the RSI indicator?
- How to set up and adjust the RSI indicator?
- How to trade with RSI?
- Using RSI with additional indicators
- How to trade with RSI like a pro
- How is RSI Used in Day Trading?
- FAQs
Features and Advantages of The RSI Indicator
As any other oscillator, the RSI indicator is not plotted on the price chart, but in a separate window below. This technical instrument consists of a single line and two levels set by default. Vertical axis range of the indicator is set to 1 to 100 showing extremality of current price against its previous values.
RSI calculation
Where:
U – average number of positive price changes
D – average number of negative price changes
What the formula means, is that if the price grows against previous values, so does indicator reading; otherwise, oscillator’s value goes down. The RSI line may reach 0 or 100 only during strong, continuous downward or upward trend, respectively.

Usually standard overbought and oversold levels are 70 and 30. If the indicator’s line goes above the 70 level, it signals that market is overbought and the trend may reverse downwards. If the indicator’s line goes below the level 30, it signifies that market is oversold and the trend may reverse upwards. The reference level is 50, and it is the median value. If the indicator chart is ranging between the levels 30 and 70, the market is flat or that the current trend is smooth, steady and there is less of a likelihood for reversal in short-term. Sometimes, overbought and oversold levels are set at 80 and 20 instead of 70 and 30. This setting is used during increased market volatility.
Setting and Adjusting RSI Indicator
There are two ways to set up this indicator. The easiest way is to click the tab ‘List of Indicators’ located on the upper panel of the terminal and select ‘Oscillators’ – ‘Relative Strength Index’.

Another option is to choose ‘Insert’ – ‘Indicators’ – ‘Oscillators’ – ‘Relative Strength Index’.
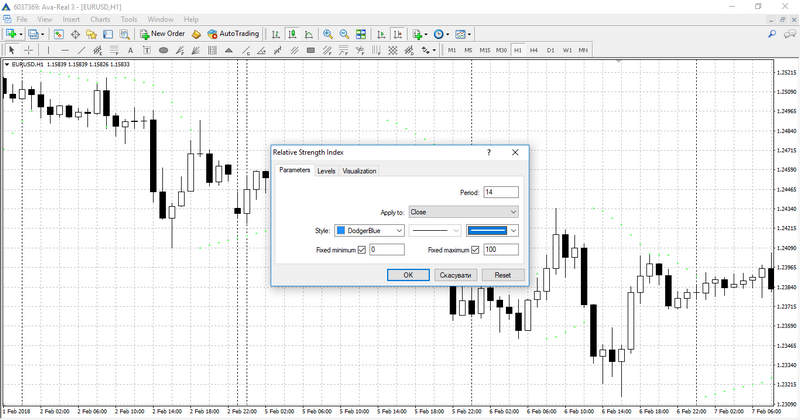
Instrument configuration window will open before the indicator is set in the chart. This window allows you to configure the indicators parameters. The main parameter is the period; It defines the number of price values taken into consideration at plotting the main indicator’s line. The shorter the period, the steeper indicator’s chart movements will be. This parameter is set to 14 by default, and this setting is considered optimal in most cases. You can also adjust the style settings, like line colour and weight. By using another tab of configuration window, you can change parameters of the levels from 30 and 70 to 20 and 80. You can also add new levels should your trading strategy require so.
Opening Positions on RSI Signals
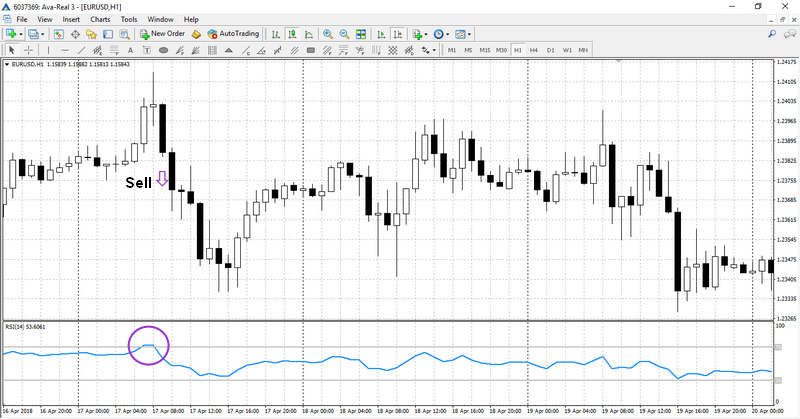
The main signal the RSI oscillator generates allows defining overbought and oversold price ranges. Although it is frequently used as a filter in systems where the main indicator is a trend one, it might be possible to try trading using RSI signals only. When indicator’s line goes above the level 70 or below the level 30, it signals that market is overbought/oversold, and it is necessary to wait for the next signal confirming a trend reversal.
These are the rules for opening positions based on the RSI signals:
- If the indicator’s line crosses the level 70 from above, a short position (Sell) is opened.
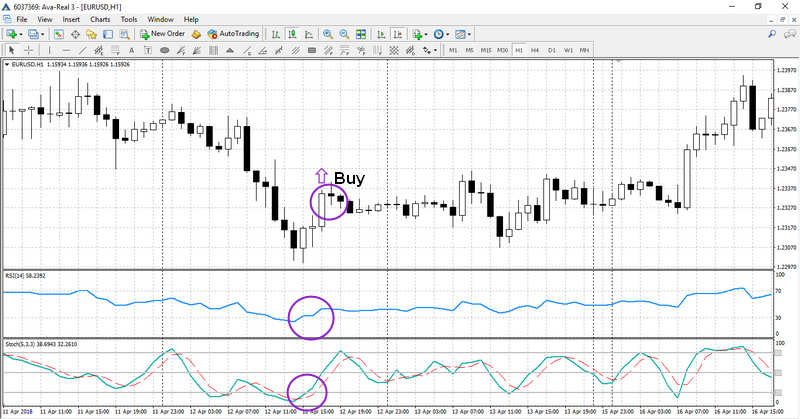
- If the indicator’s line crosses the level 30 from below, a long position (Buy) is opened.
There are several conditions for closing a trade:
- Place a Stop Loss to local extremum and Take Profit to the value that is by 2-3 times greater.
- Exit on opposite indicator’s signal.
- Place a Stop Loss and Take Profit to the nearest key levels or Fibonacci (here Take Profit level should be not less than Stop Loss otherwise it is better to hold back and avoid opening a trade).
However, trading using RSI signals only is not the best approach as it has been designed to be used as a filter and not the main instrument. A technical trading strategy will be more efficient when using a trend indicator or at least paying attention to the Price Action signals.
RSI Trendlines
Contrary to popular belief, the Relative Strength Index (RSI) is a leading indicator. This quality can be observed by using trendlines on the RSI chart and trading its break. When the RSI is rising, an upward trendline is drawn by connecting two or more lows and projecting the line into the future. Similarly, when the RSI is falling, a downward trendline is drawn by connecting two or more highs and projecting the line into the future. A break of an RSI trendline precedes an actual price reversal or continuation in the market. For instance, if the asset price breaks above a downward trendline, it is a signal that the price is about to edge upwards, either as a continuation of an uptrend or as a reversal of an existing downtrend in the market.
RSI and Chart Patterns
The Relative Strength Index is one of the best technical indicators to complement raw price action signals delivered by candlestick patterns or line chart patterns. For instance, when a bullish candlestick, such as a pin bar, or a price chart pattern, such as a double bottom, occurs in a downtrend, a buy position can be opened when the RSI displays a reading of below 30 to imply oversold conditions.
RSI Divergence
The Relative Strength Index also delivers divergence signals that could be a viable trading opportunity. A divergence occurs when the asset price and RSI do not move in the same direction. A positive (bullish) divergence occurs when the price is drifting lower, but the RSI is edging higher. This is a signal that the price may be heading towards a bottom and an upward reversal is about to happen. On the other hand, a negative (bearish) divergence occurs when the price is drifting higher, but the RSI is going lower. This is a signal that price may be heading towards a top and a downward reversal is about to happen.
RSI and RVI
Both the RSI and the RVI (Relative Vigor Index) are oscillators, but their different qualities can help traders to pick out high-quality RSI trading opportunities in the market. Whereas the RSI focuses on price extremes (high and low), the computation of RVI seeks to relate closing prices to open prices. This means that the RVI has both positive and negative numbers, with the centreline being 0. The RVI gives information on the strength of price movement, with positive values indicating increasing momentum, whereas negative values denote decreasing momentum. The RSI is the best indicator to complement or qualify the signals delivered by the RVI, especially in trending markets. For instance, if the market is in an uptrend and the RVI delivers a bearish divergence signal (prices go higher whereas RVI goes lower). In this case, a retracement or a trend reversal will be confirmed if the RSI reading is above 70, which implies overbought trading conditions.
RSI Trading Strategy and MACD
The MACD (moving average convergence divergence) indicator is very popular because of its simplicity and ease of application, as well as its graphical appeal. MACD is a trend following and momentum indicator, used to determine when the price trend is accelerating or decelerating. Because the MACD uses moving averages in its computation, it is largely a lagging indicator and can be used to qualify trading signals generated by the RSI indicator, a leading indicator. For instance, if the RSI displays a reading of above 70, which implies overbought conditions in the market, a sell position can be initiated when the MACD series shifts from positive to negative (crossing below the 0 centreline).
RSI Strategy and Bollinger Bands
Bollinger Bands is a volatility indicator whose bands squeeze when there is low volatility but diverge when there is high volatility. Periods of consolidation are usually followed by massive breakouts, which makes any Bollinger Bands squeeze a vital time to watch the markets. A breakout signal will be delivered when there is an RSI overbought or oversold failure swing. For instance, a bearish signal happens when the RSI line rises above 70 and then falls below 70 again. You could open a sell position when the prices touch the lower Bollinger band.
Combined Strategy using Stochastic + RSI
In order to boost trading efficiency, it’s best to use the Stochastic Oscillator. The absence of trend indicators in this trading strategy is compensated by simultaneous analysis of two timeframes. This way the oscillators will filter each other’s signals and trades will be opened only when both indicators give the same signals on different time frames. This strategy suggests using time frames of Н4 and М15. In Н4, the RSI will have the default settings. The only difference will be that instead of levels 30 and 70 we will set it at 50. In М15, Stochastic will have default settings.
Short position (Sell) will be opened in the following case:
- In Н4, the RSI line is crossing the level 50 from below.
- In М15, Stochastic lines exit overbought zone and heads down.

Long positions (Buy) will be opened in the opposite case. Stop Loss and Take Profit are fixed and set at distances 20 and 50 points from the opening price respectively. Such ratio enables to obtain a positive statistical expectation from trading in the long run. It is recommended to check the economic calendar before opening positions in this trading system since the release of important news can significantly influence price movement, and technical analysis won’t be relevant at this very moment.
Advanced Strategy RSI + Stochastic + МА
Finally, let’s consider strategy with three classic indicators filtering each other as a single set and giving powerful signals for entering the market. This strategy fits best for trading on Н1, Н4 and D1.
First, it is necessary to set up the following indicators in the chart:
- A moving average with the period of 10.
- An RSI with standard settings (levels 70 and 30).
- A Stochastic oscillator with standard settings (levels 80 and 20).
According to this strategy, a long position is opened when the following signals are generated:
- Price is crossing МА from below.
- RSI and Stochastic exit oversold zone.
All three signals should be received during three candles, otherwise, they will lose their value.
Short positions (Sell) should be opened in the opposite case. Exiting an open trade should be done when RSI enters the opposite zone. Sometimes, an opposite position can be opened simultaneously with closing previous position, granting other signals to follow the aforementioned pattern.
How is RSI Used in Day Trading?
When looking at how to use the RSI indicator for day trading, it is important to remember that day trading involves buying or selling underlying assets within the same trading day. Effective day trading is not merely about quantity (taking many trades within a single day) but rather about quality (taking the best high probability short-term trades). RSI trading strategies can help traders to identify and take advantage of the best intraday opportunities in both ranging and trending markets.
When trading with RSI, traders also watch out for overbought and oversold signals. While the default RSI setting is 14-periods, day traders may choose lower periods of between 6 and 9, so that more overbought and oversold signals are generated. Ideally, these levels should correspond with support and resistance levels. Thus, in a ranging market, buy orders will be placed off a support area when the RSI reading is below 30, whereas sell orders will be placed off a resistance area when the RSI reading is above 70.
In trending markets, the RSI setting can be even lower (2-6). In this way, traders can identify the best value areas to enter the market in the direction of the dominant trend. For instance, in an uptrend, traders will look to enter buy trades after a pullback that will be indicated by an oversold RSI reading. Similarly, in a downtrend, sell trades will be placed after a retracement that will be highlighted by an overbought RSI reading. Because a lower setting will generate numerous overbought and oversold signals, it is important to combine RSI and other technical indicators, such as moving averages, in trending markets so as to filter out the best quality signals when day trading. Moving averages will confirm the trend and also provide possible retracement target levels where RSI overbought and oversold signals can confirm solid trading opportunities.
Main RSI Trading Strategies FAQ
- How do you find Overbought and Oversold Levels with the RSI?
The Relative Strength Index, or RSI, is used to locate overbought and oversold conditions in financial markets. As an oscillator type indicator it does this by moving up and down within a range of 0 to 100, with 0 representing the most oversold conditions, and 100 representing the most overbought conditions. Typically any reading above 70 is considered overbought and ripe for a reversal, while readings below 30 are considered oversold and also ripe for a reversal. Some traders use the 80 and 20 levels as their signal points.
- How to use RSI in a Trending Market?
Because the RSI is typically used to detect overbought and oversold markets some traders feel it can’t be used in a trending market, but nothing could be further from the truth. One RSI trading strategy used in trending markets would be to wait for the indicator to signal an overbought condition during an uptrend. The trader then waits for RSI to drop below 50, which signals a long entry. If the trend remains in place price will typically recover off this level and move to new highs.
- How do we Discover New Price Trends using RSI Divergence?
Using divergences between the RSI and prices on the chart is considered as an aggressive use of RSI, but it also allows trends to be discovered early, thus leading to greater profits. For example, in a downtrend we might see lower bottoms for prices, but higher bottoms on the RSI. This indicates the strength and momentum of the downtrend is decreasing, which makes an upturn in price more likely. The same is true in an uptrend, although there we would see lower highs in the RSI, while higher highs are still being reached on the price chart.
Conclusion
The RSI is one of the main indicators of technical analysis, and almost all the forex trading experts think that it is still very useful and valuable as a source of trading signals. The success of trading with an RSI depends on using additional indicators in conjunction with it. Combined with the right indicators, RSI forms an efficient system, which can be fine-tuned by amending the parameters of instruments used.
Open your trading account at AvaTrade
or try our risk-free demo account!
Trading in financial markets puts your capital at risk. It is recommended to accurately follow the money management rules and always set Stop Losses to reduce risks. This article doesn’t constitute an investment/trading advice. We recommend you to visit our trading for beginners section for more articles on how to trade Forex and CFDs.


