Fibonacci Trading Strategies
Fibonacci Levels: Different Types and How to Use them
Technical analysis includes at least 6 indicators that are plotted on the chart in accordance with Fibonacci number formula. In this article we will look into all 6 Fibonacci indicators available on the MetaTrader 4 and MetaTrader 5 trading platforms. We will also discuss the technical trading strategies that are most suitable for Fibonacci indicators.
- What are Fibonacci Lines?
- What are Fibonacci Time Zones?
- What is Fibonacci Channel?
- What are Fibonacci Arcs?
- What is Fibonacci Fan?
- What are Fibonacci Extensions?
- Adjusting and Adding Levels to the Chart
- Trading with Fibonacci Levels
- Fibonacci Levels Trading Strategy
- Fibonacci indicators Pros and Cons
Fibonacci Levels and Their Types
At the heart of each Fibonacci indicator lies the following sequence 0, 1, 1, 2, 3, 5, 8, 13, 21, 34, 55, 89 … Each number in this sequence is the sum of the two previous ones. Dividing any number of the sequence by the preceding one will result in approximately 1.61. This value is used as the main ratio for all Fibonacci indicators. Fibonacci levels are used to predict the further movement of the asset price. As a rule, such indicators are tied to an existing trend so as to predict its continuation or correction. Fibonacci indicators provide benchmarks for price movements: what level the price is likely to reach, where it will reverse, etc. Based on these price targets traders place pending orders, stop losses and take profits. In general, the Fibonacci levels perform the same function, but they differ both in terms of their appearance and functioning principles.
Fibonacci Levels (Lines)
It is the most basic and popular Fibonacci tool. On the chart it looks like a grid made up of several lines. The distance between them is calculated with the help of the Fibonacci ratio. As a rule, these lines are the key levels for the price dynamics. The price tends to be drawn to the lines and often reverses when approaching such level. On the contrary, if the price breaks this level, it serves as a signal of a strong trend.
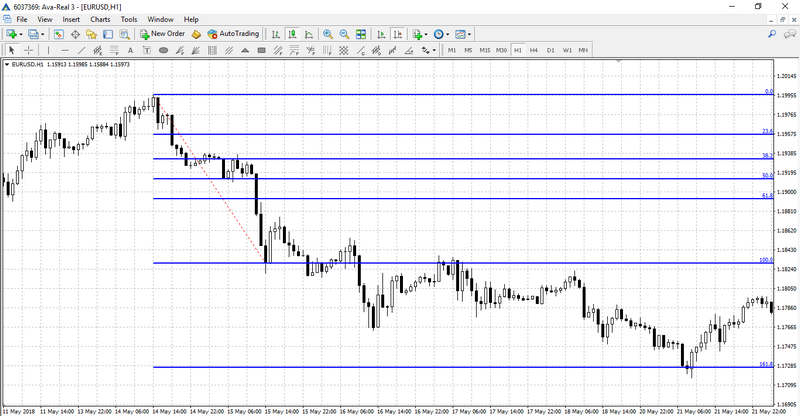
Fibonacci lines are tied to the last evident trend. A grid is stretched from the trend’s start (level 0) to its end (level 100). Thus, levels that lie within this range (61.8, 38.3, etc.) become benchmarks for possible reversals and levels that come after 100 (161.8, 261.8, etc.) become targets for trend continuation.
When following the trend and opening an order, you can set stop loss at internal levels and take profit at external levels. When trading retracements, the price targets should be set at the internal levels. You can also open positions on level breakthrough by placing pending orders.
Fibonacci Time Zones
Fibonacci time zones stand out from other Fibonacci tools. This indicator allows you to predict the next wave (retracement or trend) formation time, based on the previous momentum duration. Unlike lines, time zones are stretched from the extremum of trend’s start to the reversal point. 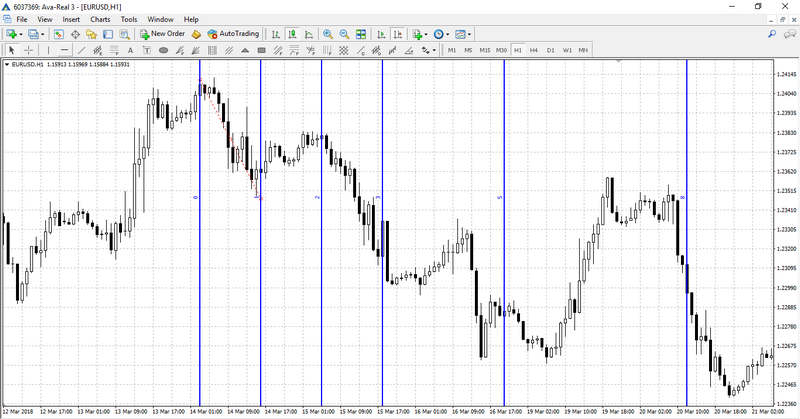
Time zones are used quite rarely because a wavelength is different for each currency pair with each time frame. Moreover, this tool does not provide concrete signals for entering the market at a particular price, and, therefore, pending orders placement is not an option with this tool.
Fibonacci Channel
Fibonacci Channel is an improved version of the lines. Unlike the lines, which are always horizontal, the channel can be inclined. This feature allows you to build trend lines grid and determine the price targets, taking into account the trend’s angle.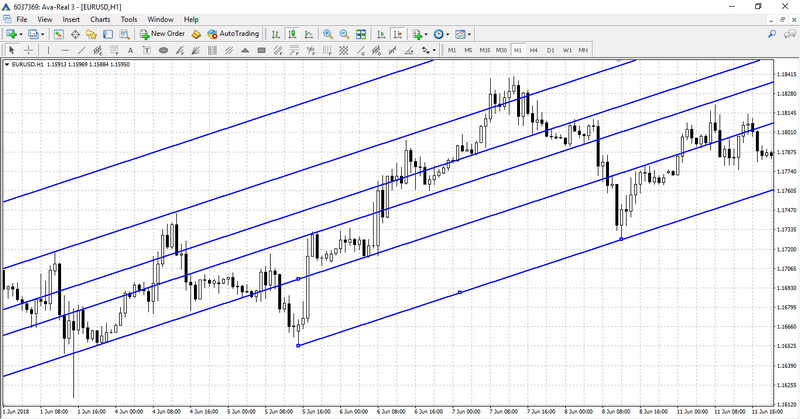
Fibonacci Channel is built based on two extrema (from the first to the second one in the direction of the trend): if there is an uptrend, then the indicator is tied to the minimum levels and if there is a downtrend, the indicator is tied to the maximum levels. The first trend line, which becomes either the main resistance or support level, is based on these points. You can adjust the position of the whole grid by moving the second line. To determine the retracements, you need to start stretching the channel against the trend’s direction, from the second to the first extremum.
Fibonacci Arcs
Arcs is a tool that is most effective when there’s a flat price movement. It is used to catch trend retracement. Just like other Fibonacci indicators, the arcs are stretched between the boundaries of a trend or wave. At the same time, the arcs can be built from the trend’s start to its end or vice versa.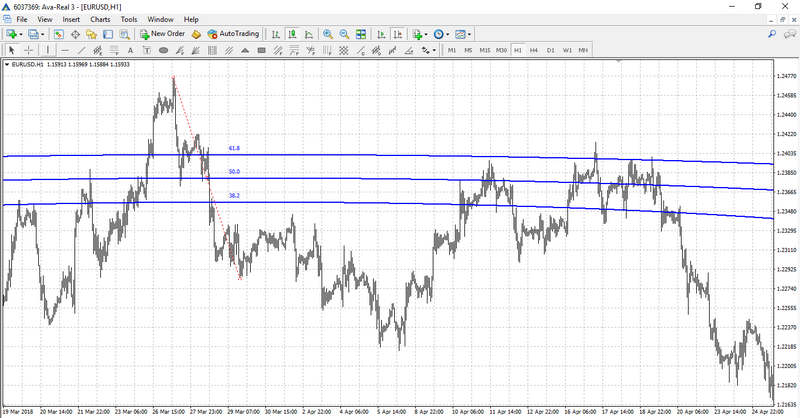
The classical version has only three arcs located within the initial trend range. However, when the price moves away from the key points, the lines diverge and widen the price targets range to some extent.
Fibonacci Fan
Fan is another dynamic Fibonacci tool. It might be compared to several rays that move from one point in different directions. The fan is stretched based on two trends or wave points starting with the first one (rays starting point).
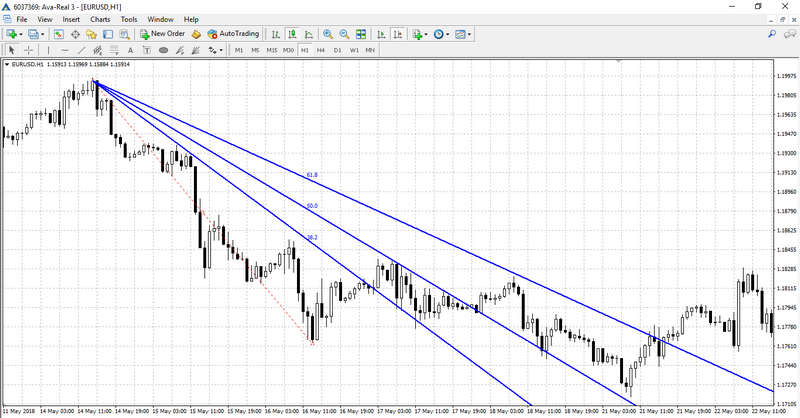
If there is an uptrend, the fan will be located under the price chart. It will be located above the price chart if there is a downtrend, indicating the trend reversal level. Moreover, the Fibonacci fan can be used with a dynamic stop loss. You should move the protective order along one of the fan lines following the price movement.
Fibonacci Extensions
Extensions are often used as an auxiliary tool in wave analysis. This indicator is built based on three points that form two waves: trend and retracement waves. Extensions indicate the next benchmarks in trend direction. This tool can be used most effectively when setting take profit orders.
Time zones, fans and arcs are quite specific and are rarely used by traders (except trading systems that are specifically designed for these indicators). Fibonacci levels (lines) is quite a popular tool that is considered to be basic and is often used together with other strategies (for example, when searching for additional signals or confirming the existing ones).
Adjusting and Adding Fibonacci Levels to the Chart
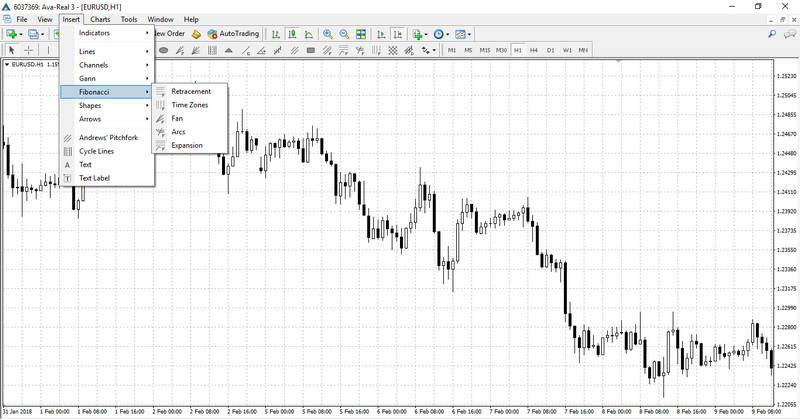
There are two ways to add Fibonacci levels on the Meta Trader 4 trading platform’s chart:
Select the “Insert” tab in the platform’s main menu, and then select “Fibonacci”. There will be 5 out of 6 Fibonacci tools in this category; the Fibonacci channel is in the “Channels” category.
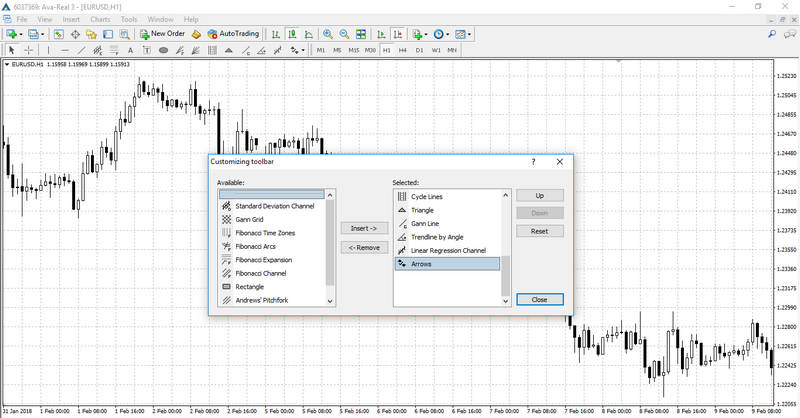
You can also select the required tool in the Quick Access Toolbar at the top panel of the platform. By default, only Fibonacci lines are available on this panel. You can add other tools by right-clicking on the panel and selecting “Configure”. A window will open and you can select all the tools you want to add to the Quick Access Toolbar.
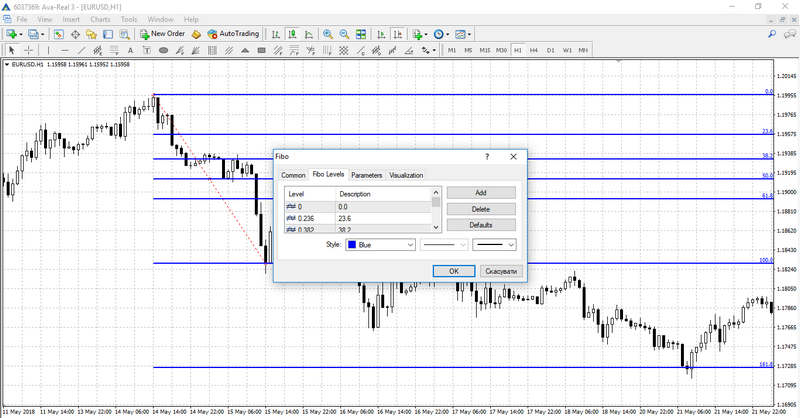
Each indicator can be adjusted after it has been added to the chart. You can change its color, adjust reference points’ parameters and add additional levels.
Fibonacci Levels Trading
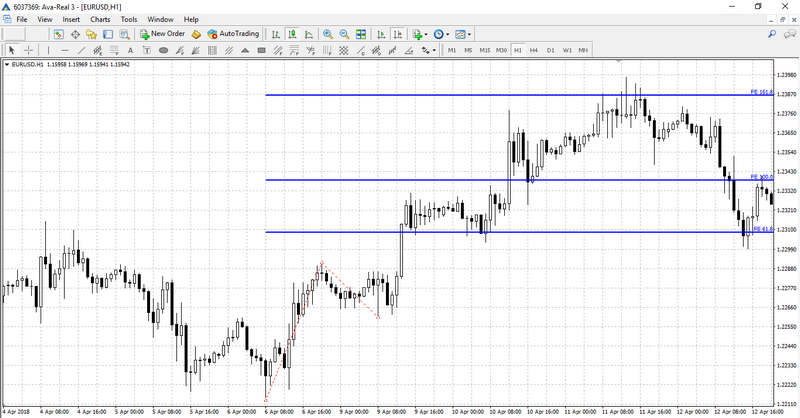
Fibonacci levels (lines) are used both as a standalone indicator and as a part of strategies based on other indicators. One of the easiest ways to open an order with Fibonacci levels is to set a pending order at breaking through 100 level after retracement. In order to do this, you need to stretch the Fibonacci grid after formation of a trend wave from the endpoint extremum to the trend’s startpoint extremum.
After that, a stop order is set below/above level 100. Take profit can be set slightly closer to level 161.8 in advance. Stop loss can be set either at the same distance from level 100 as the pending order (cautious tactic) or closer to level 61.8 (aggressive tactic).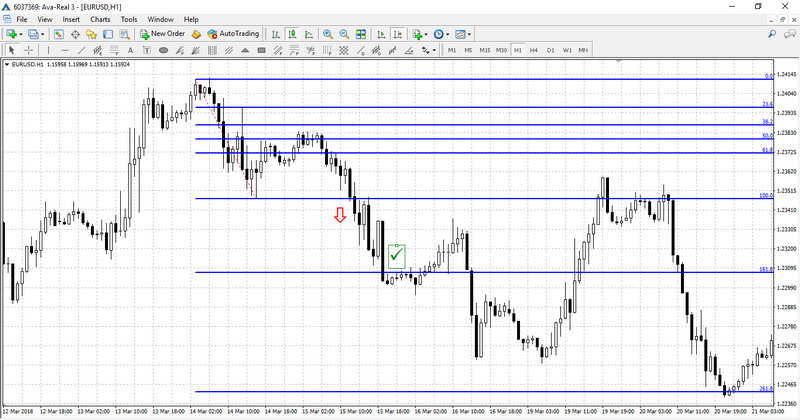
When the stop loss is set at 61.8, the risk/profit ratio is approximately 1:1.5, with a more cautious scenario the ratio is about 1:5.
Fibonacci Levels Trading Strategy
The Fibonacci levels are often used to confirm entry points or set stop losses and take profits. A trading strategy with Fibonacci levels, moving average and MACD would be a good example. Firstly, you will need to add a trend indicator and an oscillator to the chart. MA period is 10 and MACD is set to default.
The following trading algorithm is employed (in this example for a sell order):
- The price crosses the moving average upwards.
- The MACD histogram crosses the line in the same direction.
- The Fibonacci grid is stretched along the last apparent trend wave. If the price crosses the moving average at the same time with the level rebounding or breaking in the desired direction, a sell order is opened.
- Take profit can be set at one of the next Fibonacci levels. Stop loss can be set at the previous level.
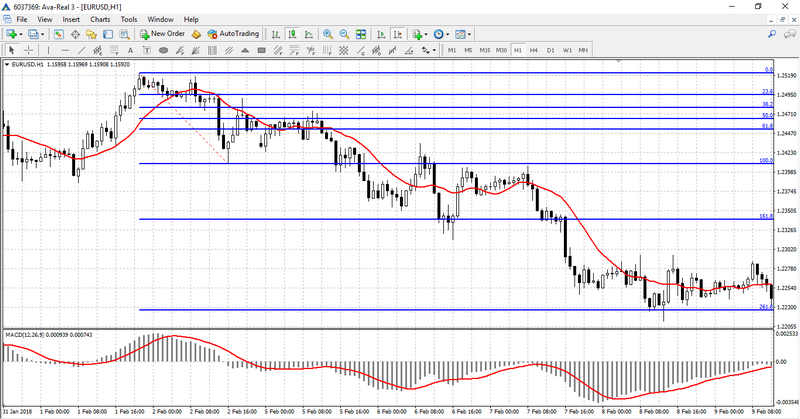
This strategy is suitable for trading with all major Forex trading pairs. The best time frames are H1-D1.
Fibonacci Levels Pros and Cons
The main advantage of Fibonacci levels is their versatility. These tools are based on more than a hundred-year-old theory that has been actively used in the stock market and Forex market analysis for decades. Recently, it has been adopted in the cryptocurrency trading as well. The tool’s versatility allows it to be relevant regardless of the market changes, whether it is more volatile or calm.
Another advantage of this instrument is its wide range of applications. Fibonacci levels can be used both for opening new orders and finding market exit points. The main drawback of the Fibonacci indicators is the necessity of a preliminary analysis. With other indicators it is enough to add them to the trading chart. They are automatically set and start generating trading signals. The levels, however, should be set manually and traders have to determine the reference points themselves.
Fibonacci Levels will be an excellent tool for experienced traders and help them make profit in the financial markets. Beginners, however, will benefit from studying the wave theory basics first. They should also master the basic methods of levels trading before starting to use various Fibonacci tools. Trading in financial markets is associated with high investment risks. To reduce these risks it is necessary to accurately follow the money management rules and always set stop loss. This article doesn’t constitute an investment/trading advice.
Main Fibonacci Trading Strategies FAQ
- What is Fibonacci Trading?
Fibonacci trading is based on a key series of numbers discovered in the 13th century by Italian mathematician Leonardo Fibonacci. The series of numbers is created by adding each of the next two numbers in the series to create the following number. Thus the series goes 0, 1, 1, 2, 3, 5, 8, 13, 21, etc, into infinity. In technical analysis of financial markets the numbers themselves aren’t as important as the ratios between the numbers. Traders use these ratios – 23.6%, 38.2%, 50%, 61.8%, and 100% – to identify support and resistance areas for markets.
- What are Strategies for Trading Fibonacci Retracements?
Fibonacci retracement levels are created by taking the high and low price points on a chart and marking the key Fibonacci ratios on the chart horizontally, thus creating areas of support and resistance where prices are likely to reverse. Often these levels are used as part of a trend trading strategy, where traders look for prices to retrace when reaching the key Fibonacci ratios, and then enter in the direction of the original trend. Traders often add other indicators to their trading strategy to confirm the signals given by the Fibonacci retracements.
- How are Fibonacci Extensions used in Trading?
Fibonacci extensions are levels that are drawn beyond the 100% level and these levels are often used by traders to identify potentially good areas for exiting a trade and taking profits. They can also be good areas to watch for reversals or pullbacks. The major Fibonacci extension levels are 161.8%, 261.8% and 423.6%. It’s important to note that Fibonacci extensions are simply possible areas of interest. For example, price may move just slightly above the 161.8% level before reversing, or it could stop just shy of that level and reverse.
Join AvaTrade today and start trading like a pro
or practice your trading skills on our free demo account!


