Renko Charts

Renko charts are a type of trading chart designed to filter out market noise and help traders definitively identify prevailing trends in the market. Renko charts are of Japanese origin, and they are believed to derive their name from the word ‘renga’, which is Japanese for ‘bricks’.
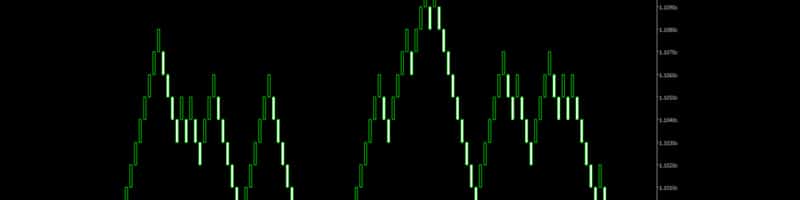
In essence, Renko charts are plotted as a series of bricks representing price movement and completely ignoring the time factor. A brick will only be printed when the price has made a specified amount of movement, no matter the time required to achieve that.
Naturally, the bigger the brick size, the lesser movement a Renko chart will display. But on the flip side, a very small brick size will erode the meaning of a Renko chart.
See a trading opportunity? Open an account now!
Construction of Renko Charts
Renko bars or bricks are constructed using only closing prices and are placed at 45-degree angles next to each other. While they have a time axis, it is only meant to be considered if the set movement (closing prices) has been realized and not to show elapsed time. Bullish bricks form above the previous bricks, whereas bearish bricks form below the last bricks.
Renko bricks are never drawn next to each other. For an opposite brick to be printed next to the other, the asset price must move at least twice the set movement. For instance, if a brick size is 50 pips, for a Renko chart to show a transition from a bullish brick to a bearish brick, the price must close lower by at least 100 pips.
Renko Charts vs Heikin Ashi Charts
Renko charts are typically compared with Heikin Ashi charts, another type of trading chart of Japanese origins. While Renko charts feature boxes drawn as described above, Heikin Ashi charts look similar to typical charts, but their candlesticks are computed differently. A standard candlestick will display information about the current open, close, high, and low prices. But a Heikin Ashi candlestick will be constructed using these price levels and include additional price information from the previous period.
A Heikin Ashi candle also has open, close, high, and low prices, but only the high and low are similar to the typical candlestick. The open and close prices are computed differently.
A Heikin Ashi Open represents the midpoint of the previous candlestick. It is computed by finding the average of the open and close prices of the previous candlestick. The Close of a Heikin Ashi chart represents the average price of the current period. It is computed by finding the average of the current period’s open, close, high, and low prices.
The computation of Heikin Ashi shows that the chart is designed to display the rate at which average prices change. Heikin Ashi translates to ‘average bar’ in English. Heikin Ashi charts help identify when the price is trending and when the trend is likely to pause or reverse.
The different construction methods of Renko and Heikin Ashi also mean that they will deliver different price action signals. As such, they should be interpreted differently. Renko charts will highlight the long-term trend, whereas Heikin Ashi charts show how recent average prices change.
Trading with Renko Charts – Renko Trading Strategy
A Renko forex strategy may help traders identify quality trading opportunities. Here are some of the signals delivered by a Renko chart:
Renko Support and Resistance Levels
Renko charts show strong support and resistance levels when the bricks alternate at a certain price area for some time. At these levels, traders can trade range-bound strategies and watch out for potential price breakouts. A range-bound play will involve buying near support areas and selling near resistance. Because Renko charts highlight strong support and resistance areas, traders can watch out for price breakouts and ride the new trend.
Renko Chart Patterns
As Renko bricks are drawn over time, they also form chart patterns that can be found in typical candlestick charts, such as double tops and double bottoms, head and shoulders, and triangles. When such chart patterns form on a Renko chart, they are easy to spot and are more reliable and have high probability opportunities.
Trailing Stops
Renko charts make it easy for traders to identify the long-term dominant trend. This could be an opportunity for traders to ride the trend for long-term profits. While this is great, it is also essential to book partial profits as the trend runs along. Renko charts are ideal for identifying the optimal price areas where trailing stops can be placed to maximize the profits of following an existing trend.
Renko charts deliver quality and reliable signals to traders. However, the formation of boxes can sometimes be prolonged; and this can deny traders the chance of exploiting a good opportunity early on. While long-term traders will not mind this, it could be very limiting for short-term trading strategies such as scalping.
Pros and Cons of Renko Charts when Trading
Here are some of the pros and cons of trading with Renko charts:
Pros
- Renko charts provide a broader view of the market and help identify long-term trends in the market (short-term noise is filtered out).
- Renko charts help traders identify strong support and resistance areas in the market.
- Renko charts help traders ride long-term trends for maximum profits.
- Renko charts help traders identify markets where the trend has definitively reversed. This can assist in determining when to offset positions in trending markets.
Cons
- Renko charts are constructed by using only closing prices. This leaves out important price information such as open, high, and low prices.
- Renko charts can be very limiting for short-term trading strategies such as scalping by using only closing prices.
- Renko charts are also prone to false signals, especially when there is choppy price action in the market, leading to bullish and bearish bricks alternating several times.
See a trading opportunity? Open an account now!
FAQ
- Is the Renko chart reliable?
The Renko chart can be very reliable. It may help traders identify dominant trends and strong support and resistance levels in the market.
- Are Renko charts good for day trading?
Renko charts could be ideal for day trading because they may help traders focus on only placing trades in the dominant trend in the market.
- Are Renko charts good for scalping?
Scalping is an aggressive short-term strategy that seeks to profit from small price changes in the market. Scalping on Renko charts may not ideal because the bricks may form slowly, and some price information may not considered.
** Disclaimer –While due research has been undertaken to compile the above content, it remains an informational and educational piece only. None of the content provided constitutes any form of investment advice.


